Presentation of results of numerical simulation of crystal growth.
The "Results" panel of LeoMonteCrystal aims to visually present a current state of numerical simulation experiment for growing surface of the crystal.
The Fig. 1 shows screenshot of the “Results” panel.
|
|
||
| Fig. 1. The "Results" panel of LeoMonteCrystal aims to visually present a current state of numerical simulation experiment for growing surface of the crystal. |
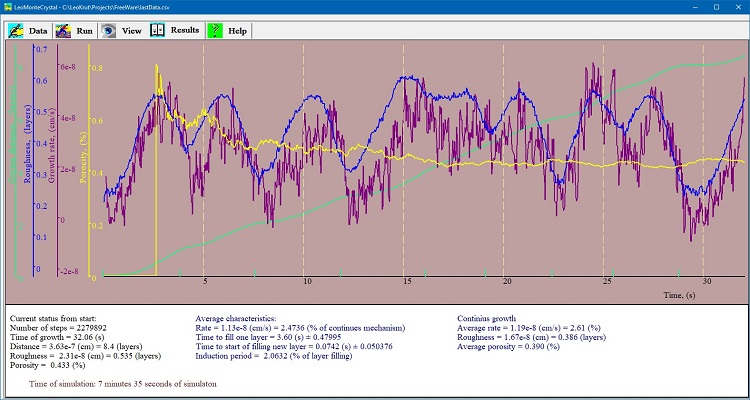
The chart area of the Results panel contains for curves with time of growth as an argument :
- A growth distance of the progressed surface in its perpendicular direction. It represents a progression of position of the surface defined as average value elements in simulation matrix. At the time axis there are also marks at moments when next layer is complete (more precise when average position of surface reaching over integer value of layers in direction of growth).
- Roughness of the surface defined as standard deviation positions of elements of simulation matrix.
- Growth rate defined as time derivative of displacement position of the surface.
- Porosity, concentration of hole like defects, appeared during the growth by mechanism of plugging the neck of bottle (well) like structures at the surface of the crystal.
The panel "Results" displays also:
Current status from start of the simulation experiment:
- Number of time steps.
- Time of simulated period that is equal to number of steps by time step value. Note that if value of time step is changed during pause the definition of time of experiment would be more complex but actual number at the Result panel will be correct.
- Distance of surface advance in direction of growth in actual length units as well expressed in number of layers.
- Current roughness of the surface.
- Current porosity (concentration of defects) below surface.
Average characteristics of simulation experiment for given moment in simulation are:
- Growth rate in absolute measurement units as well in percentage of theoretical growth rate for continues growth mechanism. Growth rate expressed as part of rate for continues mechanism demonstrates influence of surface energy on mechanism of the growth for given set of parameters.
- Time to fill on layer (seconds) and standard deviation of this value..
- Time to start of filling next layer that is physically presents time when on next completely filled, smooth surface random event of formation over critical nucleus able to self-sustained growth is occurred. Standard deviation of this value is shown too. Important to keep in mind that this value has physical sense only in the situation when crystal growth is obeyed to mechanism of two dimensional nucleation or close to it.
- Induction period is ratio of average time to start filling a smooth layer to average time to fill it completely measured in percentage.
General characteristic of simulation:
- Established mechanism
- Average growth rate
- Roughness
- Porosity
General characteristics are differ from average characteristic because they are calculated only after stable mechanism of growth is settle down for last layers only. Usually difference is negligible compare to big picture.